Overview
As a partner of ShoppingGives, you have access to exclusive data and insights into the store in your organization’s donations so you can measure and track how your impact strategy is performing as a whole, as well as in comparison to orders without donations. Within the global dashboard, you will be able to see insights for total donations, revenue generated on orders with donations, total orders with donations, donation activation rate, unique nonprofits supported, top nonprofits, and top AOV by nonprofit in USD.
Viewing and Filtering the Dashboard
By default, when you log into the Global Dashboard of the Impact Portal, the dashboard will show you data from the last 30 days in USD. You can however update the filter to view by today, last month, all time, custom timeframe, etc.
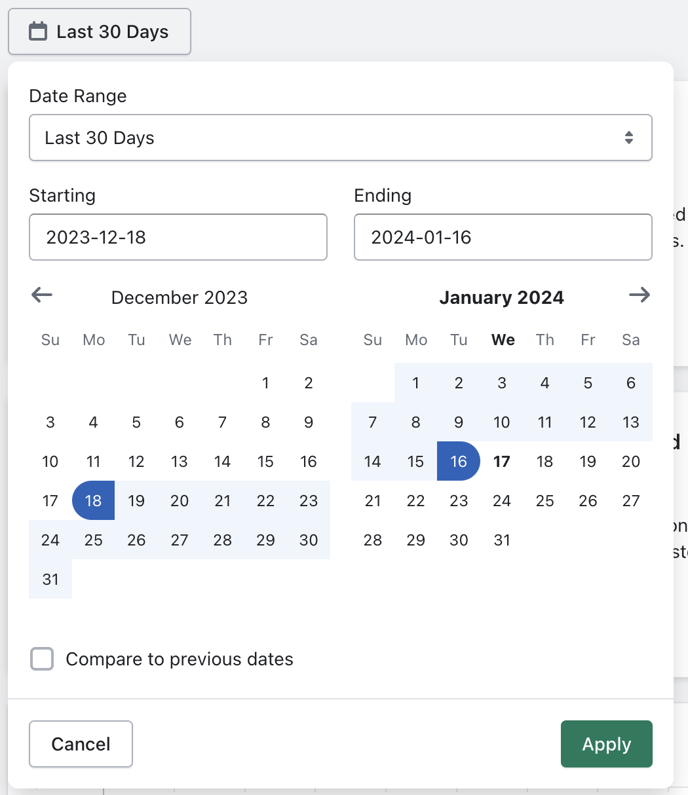
In addition to filtering by time frame, you can also filter the dashboard data by Campaigns Channels, Donation Type, and Stores.
By default, we show all donations data. If you’d like to further slice your data, you can click on any filter to begin. Applying a filter will adjust all the metrics on the dashboard to correspond with the new parameters.
- Channels will allow you to filter donations by their source channel; “Online Store” and/or “Point of Sale”.
- For example: If you apply the Channels > “Point of Sale” filter to your Dashboard, the Donation Activation Rate will now be based on transactions made at Point of Sale, and exclude online store transactions.
- Donation Type will allow you to filter donations by “Customer-Funded” or “Store-Funded” donations
- For example: If you apply the Donation Type > “Customer-Funded” filter to your Dashboard, the metrics will only reflect customer paid donations data. Any donations that you (the merchant) paid for, will be omitted from the data.
- Campaigns will allow you to filter by the “Store Donation on Purchase”, “Round-Ups”, “Add-Ons” and “Post-Purchase Donations” campaigns
- Stores will allow you to mix and match which store data you want to include in your aggregate dashboard
If a filter is disabled or not present, this is because you either do not have this campaign or channel enabled in your account.
Dashboard Insights
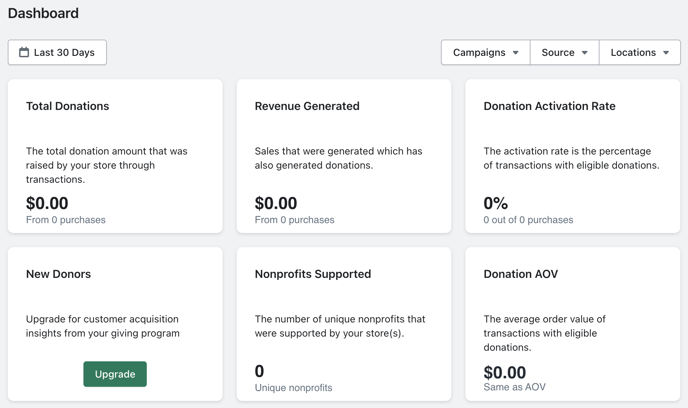
Here we provide details on each section of the dashboard.
Total Donations
This section of the dashboard will tell you how much in donations your stores have generated so far. This value excludes any refunded purchases that also contained donations. By default, you will see this data from the last 30 days, but as mentioned above, you can filter by the specific time frame you would like to view. This section gives you a view of your donations generated by dollar amount as well as how many purchases those donations are based on.
Revenue Generated
This section of the dashboard will tell you how much revenue your stores have generated on orders with donations. Please note that this is not your total revenue, as this section only pulls in data based on orders that were placed that had donations associated with them. From here you can view the amount of revenue by USD as well as how many purchases that revenue is based on.
Orders with Donations
This section of the dashboard will tell you how many orders you have had with donations. This value excludes any refunded orders that also contained donations. Please note that this is not your total number of orders, as this section only pulls in data based on orders that had donations associated with them.
Donations Chart
This section of the dashboard will give you a visual overview of your donation performance. As before, once you choose to filter by a different time frame, this chart will be updated to reflect donations during that specific time period. Additionally, if you hover over any point on the chart, you will be able to see the exact donation amount that was generated on a specific date.
Donation Activation Rate
The Donation Activation Rate is defined as the percentage of orders with donations out of total eligible orders made during the given time period. We define an “eligible order” as any orders that were made while your giving program was active, as this means your customer had the opportunity to opt-in to a donation or not.
If you are utilizing a default cause or the Donate to Causes You Set and Manage by Product giving experience, you will most likely have a donation activation rate of 100%, or close to it, because every purchase from your store is automatically creating a donation. If you are not defaulting donations on all purchases, this is a great indicator of how often your customers are choosing to select a cause to make a donation with their purchase.
Please note that if the number of Orders With Donations at the top-right of your dashboard and the numbers of purchases with donations outlined in your Donation Activation Rate do not match, don't be alarmed! The reason for this discrepancy is that the Orders With Donations value excludes purchases that have been refunded, while the Donation Activation Rate includes refunded purchases, as those orders were activated by a donation.
Nonprofits Supported
This section of the dashboard will show you the unique number of nonprofits supported by your customers. If you enable your customers to search and select a cause of their choice, this is a great way to see if this feature is being used by your customers or if they stick to the featured causes you display for them.
Top Nonprofits
This section of the dashboard will show you your most supported nonprofits and their corresponding raised donation amounts. If you enable your customers to search and select a cause of their choice, this is a great way to see which causes your customers care about most.
Top AOV by Nonprofit
Similar to the Top Nonprofits section, this section of the dashboard will show you your top AOV by nonprofit. This means that while Feeding America, for example, could be your top supported nonprofit, orders that supported Habitat For Humanity may have a higher AOV than orders that supported Feeding America. This is a great way to see how much your customers are spending in relation to which causes they are supporting with their purchase.
If you have any questions about the ShoppingGives dashboard, how it works, and what’s included, you can reach out to our team at support@shoppinggives.com and we’d be happy to help!